TradingView – Charting App
TradingView is the best charting application for Crypto, Stocks, Forex, Futures, Indices, Bonds, and more… Exchanges integrate TradingView charts right into their platforms. I would say it’s the most widely used charting application in the digital assets / crypto community. It’s super customizable with all sorts of indicators that you can overlay.
TradingView is a popular charting application that offers a variety of features for traders and investors. Some of the best features include:
- Interactive charts: TradingView’s charts are highly interactive, allowing users to zoom in and out, add indicators, and draw trend lines.
- Wide range of financial instruments: TradingView supports a wide range of financial instruments, including stocks, futures, forex, and cryptocurrencies.
- Large community: TradingView has a large community of users who share their charting ideas and insights, providing valuable perspectives and trading opportunities.
- Built-in indicators: TradingView offers a variety of built-in indicators, such as moving averages, RSI, and MACD, which can help traders identify patterns and trends in the markets.
- Customizable watchlists: Users can create watchlists to track the markets and securities they’re interested in.
- Social Integration : TradingView has social integration with other traders and investors, you can follow, message, and share your charts and ideas with others.
- Mobile App support: TradingView is also available on mobile app, which means you can access your charts and watchlists on the go.
- Programming interface (API): TradingView also offers an API for developers to build their own applications and automations on top of the platform.
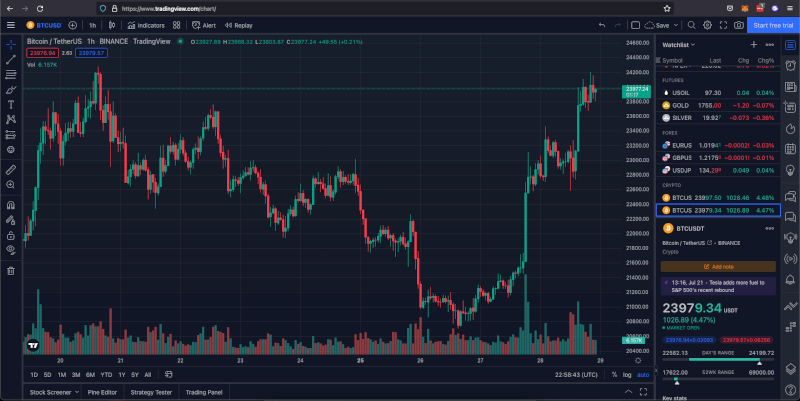
Interactive Charts
TradingView’s interactive charts are designed to be highly customizable and user-friendly. They offer a wide range of features that allow users to analyze markets and make data-driven trading decisions. Some of the key features of TradingView’s interactive charts include:
- Multiple timeframes: Users can view charts at different timeframes, including intraday, daily, weekly, and monthly.
- Customizable indicators: TradingView offers a wide range of built-in indicators, and users can also add custom indicators or create their own using Pine Script, the proprietary programming language of TradingView.
- Drawing tools: TradingView’s charts include a variety of drawing tools, such as trend lines, Fibonacci retracements, and shapes, which can help users identify patterns and trends in the markets.
- Multiple chart types: TradingView supports various chart types such as candlestick, line, and area chart.
- Alerts: Users can set alerts to notify them when certain events occur on a chart, such as a price breaking a trendline.
- Save, export, and share charts: TradingView allows you to save, export, and share charts with others, this is a great feature if you want to share your analysis with others.
- Overlay multiple symbols: You can also overlay multiple symbols on the same chart to compare their performance.
- Multiple data ranges: Users can view historical data going back several years and can also compare different data ranges on the same chart.
All these features combined provide traders with a powerful tool to analyze market trends, identify patterns and make well-informed decisions.